

1. The Hamas-Israel War
The 2023 war between Hamas and Israel elicits many different explanations. As with previous regional hostilities, here too, the pundits and commentators have numerous overlapping processes to draw on – from the struggle between the Zionist and Palestinian national movements, to the deep hostility between the Rabbinate and Islamic churches, to the many conflicts between Israel and Arab/Muslim states, the contentions between the declining superpowers (United States and Russia) and their rising contenders (like China, Iran, Turkey), the rift between western and eastern cultures, and so on.
The experts also highlight the growing importance of local militias – from Jewish settler organizations, to ISIS, Hamas, Islamic Jihad, Hezbollah, the Houthi movement, the Wagner Group and Kadyrovites Chechens – groups that operate under different political, religious and criminal guises, with varying financing and support from local, governmental and international sources to proxy and/or challenge different states. [2]
Our article does not deal with these specificities. Instead of focusing on the particular and unique, we concentrate on the general and universal. Concretely, we argue that the current war between Hamas and Israel shares an important common denominator with prior clashes in the region – namely, that it constitutes an energy conflict and that it correlates with the differential nature of capital accumulation. We coined these two terms in the late 1980s and have studied their underpinnings and implications for the Middle East and beyond ever since. [3] Our purpose in this paper is to highlight our theoretical arguments, update some of our key empirical evidence and show how both the theory and findings apply to the current Hamas-Israel war.
2. OPEC and the Petro Core
The late 1960s witnessed the emergence of a loose coalition between OPEC, the large oil companies, armament contractors, global construction firms and financial institutions, surrounded by shabby arms dealers, politicians, local militias, terrorist groups and media influencers – all connected, directly and indirectly, to military conflicts and energy crises in the Middle East. We labelled this alliance the ‘Weapondollar-Petrodollar Coalition’.
The uniting force of this coalition is the price of oil. The gyrations of oil prices cause the incomes and profits of coalition members to soar and sink, as their interests diverge and converge with the ebb and flow of regional conflicts and energy crises.
The process ping-pongs, somewhat mechanically, between arms races, open conflicts, energy crises, rising oil prices, increasing state revenues and soaring corporate profit. The Middle East, soaked in multiple tensions, superpower confrontations and mutual suspicions, generates periodic wars at alternating hotspots. These wars help create a sense of ‘energy scarcity’, leading to ‘oil crises’, higher oil prices, rising oil exports and increasing oil-company profit. Soaring oil revenues are in part recycled by financial institutions into global stock and bond markets, but they also help refuel an arms race of imported weapons and military facilities that enrich swarms of international military contractors and construction companies, while equipping potential combatants for yet another round of hostilities and even higher oil prices, so the lethal creation of wealth can start anew.
Let’s unpack these relations, starting with OPEC and the large oil companies. During the 1960s, oil producing countries embarked on a seemingly independent course, limiting oil company concessions, demanding higher royalties and eventually nationalizing their oil resources and facilities. Initially, these developments seemed congruent with the postwar decolonization movement, but soon enough they metamorphosed into a new, post-imperial alliance between the countries and the companies. On the face of it, the large oil oligopolies were stripped of their physical Middle East assets, but their new collaboration with OPEC’s overlords enabled them to achieve something they could have never accomplished on their own: a large, sustainable increase in the price of oil. Between 1972 and 1980, the price of oil, expressed in constant U.S. dollars, rose more than sevenfold.
The merits of this new arrangement were aptly summarized by Saudi oil minister, Sheikh Yamani, in 1969, well before the first ‘oil crisis’:
For our part, we do not want the [oil] majors to lose their power and be forced to abandon their role as a buffer element between the producers and the consumers. We want the present setup to continue as long as possible and at all costs to avoid any disastrous clash of interests which would shake the foundations of the whole oil industry (cited in Barnet 1980: 61).
The arrangement proved that, in matters of income and profit, prices were often far more important than output; or more accurately, that the threat of restricted output helped solidify prices so that profit could rise by even more. To illustrate, the 1979 Islamic revolution in Iran deprived British Petroleum of access to 40 per cent of its global crude supplies; yet, in that year, BP’s profit soared by 296 per cent – more than that of any other major company (Turner 1983: 204; Yergin 1991: 484-487; Fortune 500, 1978, 1979).
Figure 1 shows the intimate connection between OPEC and a Petro Core made up of the world’s leading listed oil companies. The dashed line represents OPEC’s aggregate oil exports (left scale), whereas the solid line shows the combined net profit of the Petro Core (right scale). We show both in constant 2022 dollars.
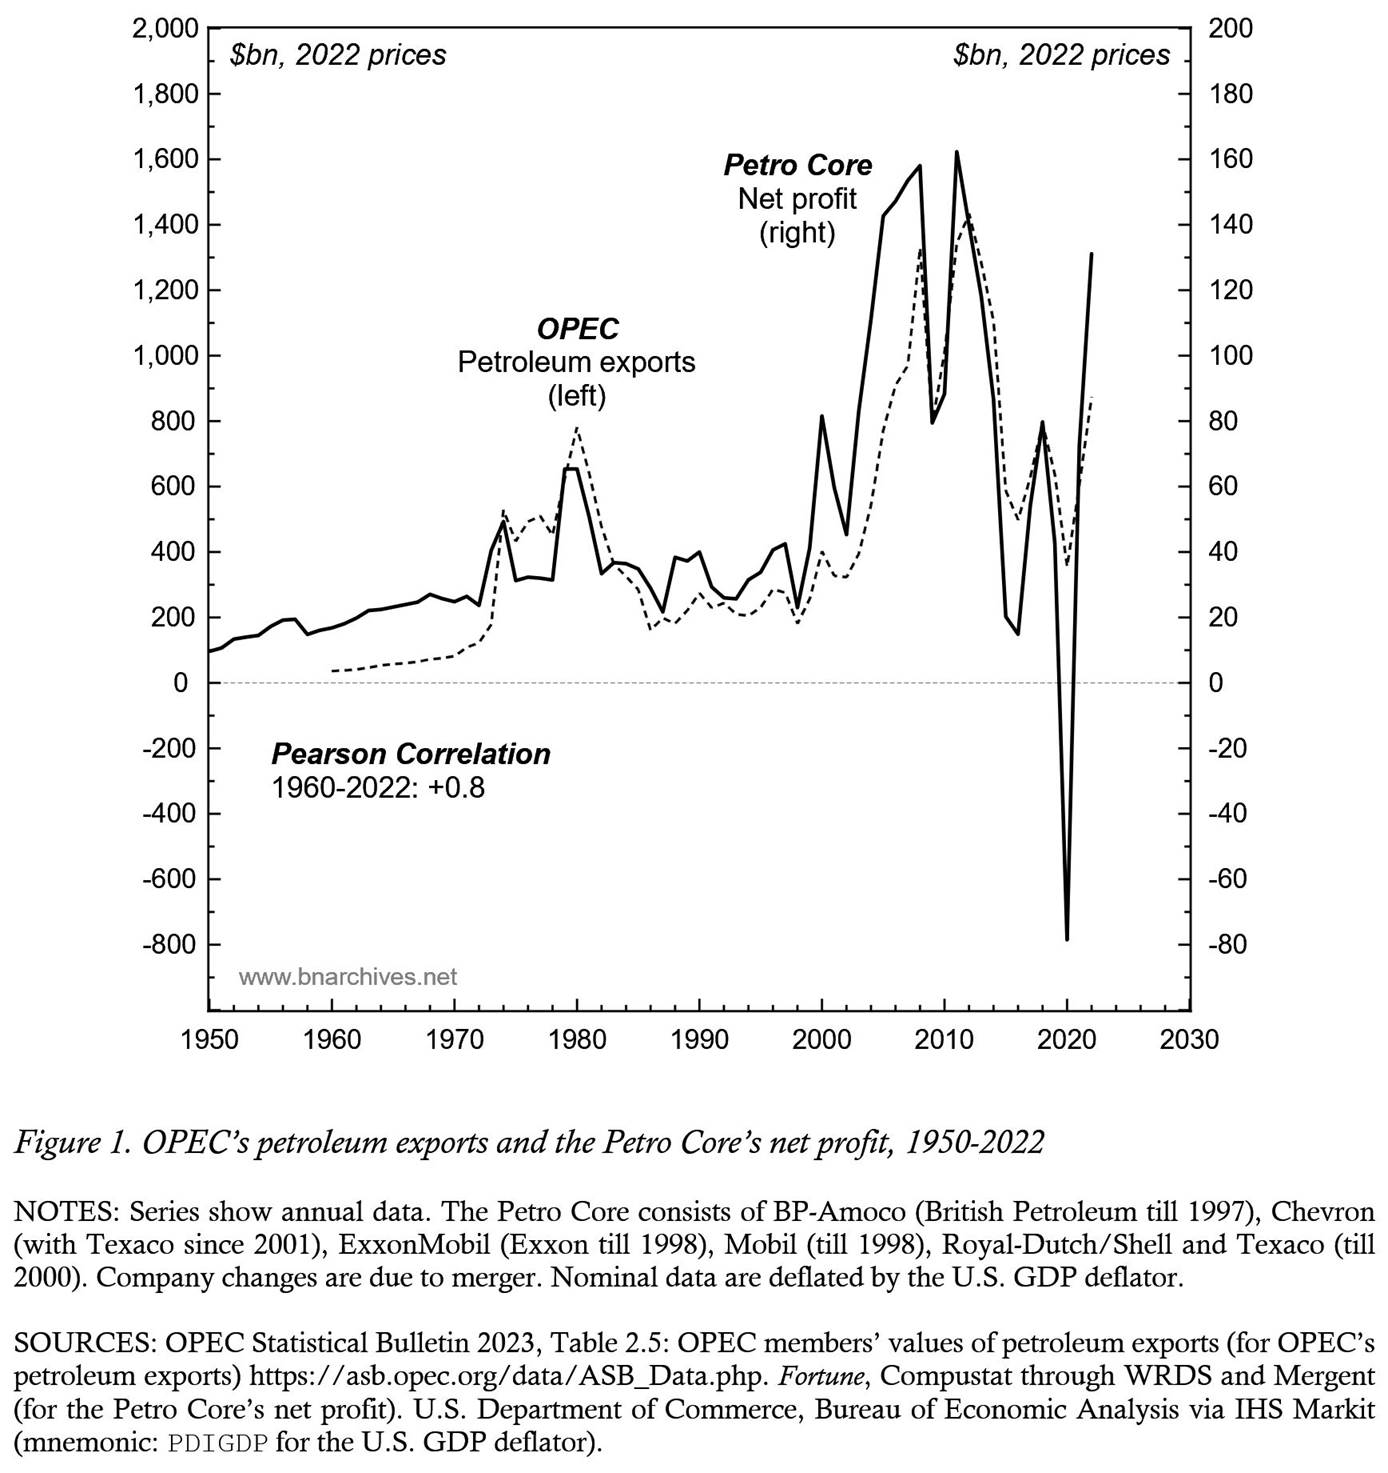
According to the chart, the flow of oil exports is roughly one order of magnitude larger than the flow of oil profit. But contrary to the politically correct view where OPEC represents the peripheral world (or Global South, in today’s lingo) and the oil companies stand for the West, the data indicate that the interests of the two groups are one and the same. Over the 1960-2022 period, the movements of OPEC’s oil exports and the Petro Core’s net profit have been positively and tightly correlated, with a Pearson coefficient of +0.8 out of a maximum value of 1. In other words, insofar as energy conflicts (or their absence) have enriched (or depleted) the oil companies, they have also enriched/depleted OPEC – and vice versa.
Zeroing in on the more recent period, we can see how the 2010s were disastrous for both groups. By 2020, the Petro Core saw its net profit collapse by a whopping 150 per cent relative to its early-decade highs, leaving it with record losses. OPEC’s downturn seemed a bit less severe, with oil exports falling by ‘only’ 75 per cent. However, considering the organization’s rapid demographic growth – roughly 350 per cent since 1960 – it follows that, in per capita terms, OPEC was back to where it started, before the arrival of the blessed oil crises.
But that was the abyss. Russia’s 2022 attack on Ukraine helped reverse the downturn with rising OPEC exports and exploding oil company profit, and the 2023 hostilities between Hamas and Israel, although yet to be imprinted on the oil books, could end up boosting them further.
3. It’s all in the price
The tight co-movement of OPEC’s oil exports and the oil companies’ net profit is no coincidence. It arises from their co-dependence on oil prices and is affirmed by their common obsession with differential performance. Let’s see how.
Figure 2 shows the global differential earnings per share (EPS) of listed oil & gas firms, measured as the ratio between their average EPS and the average EPS of all listed firms in the world (solid series, left scale). For context, our theory of capital as power (CasP) argues that, contrary to what mainstream economists tell us, corporations and capitalists are driven not to maximize their profit and wealth in order to increase their hedonic pleasure, but to ‘beat the average’ and exceed the ‘normal rate of return’ in order to augment their organized societal power (Nitzan and Bichler 2009). From this viewpoint, a rise in the differential EPS of the oil companies indicates that they beat the average and increase their power, while a decline suggests that they trail the average and see their power fall.
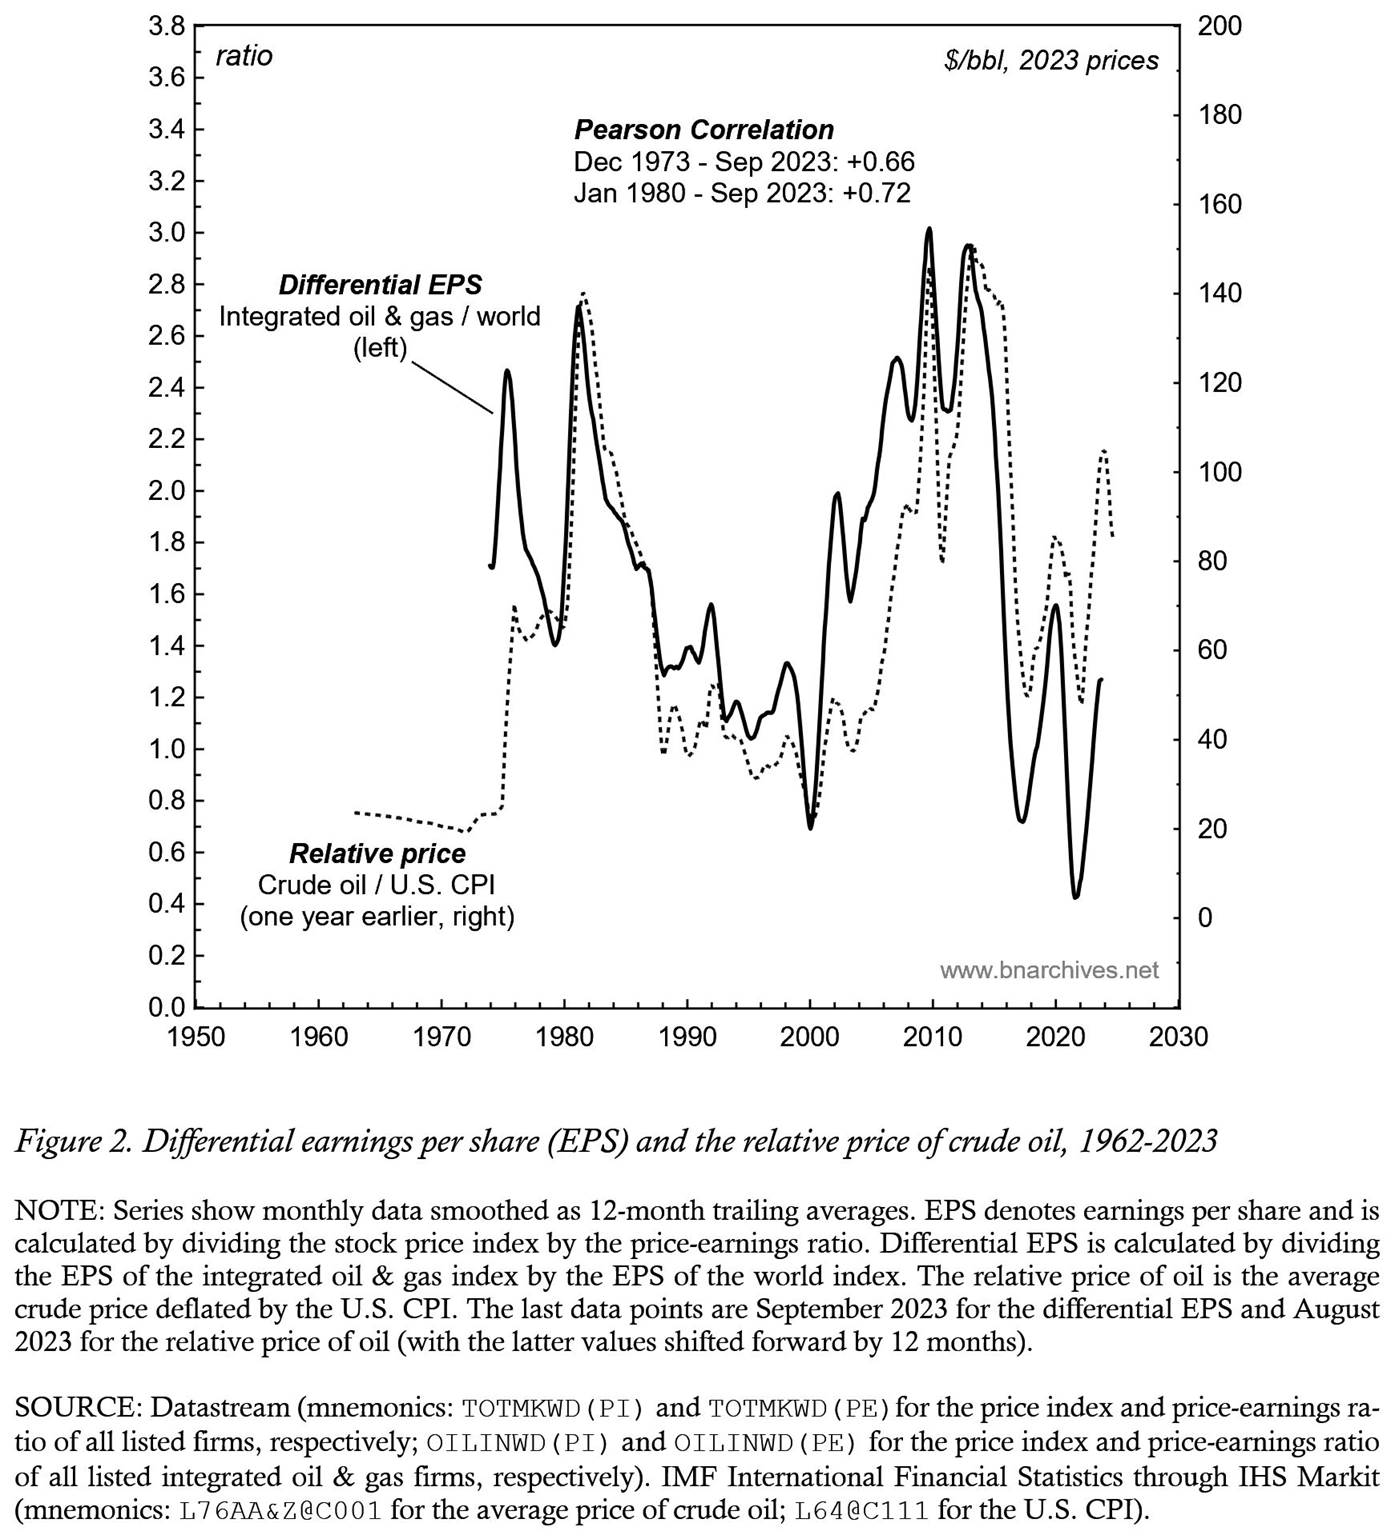
The figure also plots the relative price of oil, measured as the ratio between the dollar price of crude oil and the U.S. Consumer Price Index, or CPI (dashed series, right scale). [4] An increase in the relative price of oil means that the dollar price of oil rises faster (or falls more slowly) than that of the benchmark basket, while a decrease suggests that it falls faster (or rises more slowly).
So, we have a conceptual correspondence: our differential EPS compares the net profit per share of oil & gas companies to that of all companies, while our relative price relates the price of oil to the average price of commodities sold by all companies.
Before proceeding, note that since crude oil is mostly an input for the oil companies, it takes time for it to be processed/refined, marked up and translated into profit. For this reason, our chart juxtaposes the differential EPS series with the relative prices prevailing 12 months earlier. Also, to smooth out short-term fluctuations, we express both series as 12-month trailing averages.
And the results leave little to the imagination: based on the R2, the variance of the relative price of oil explains 66 per cent of the variance of the differential EPS of the oil companies since December 1973, and as much as 73 per cent since January 1980. In other words, oil companies increase their differential EPS mostly through differential inflation. And given the close correlation between net oil profit and OPEC’s oil exports shown in Figure 1, we might expect relative prices to have had a similar impact on the share of OPEC’s oil revenues in global GDP.
This parsimonious relation allows us to dump a lot of unnecessary baggage. To predict next year’s differential EPS of the oil companies (and OPEC’s relative oil exports), we no longer need economists to lecture us about supply, demand and equilibrium, sophisticated analysts to overcharge us for hedged econometric prophecies, strategists to guess future demand from China and supply conditions in Saudi Arabia, and researchers to study the shifting balance between fracking and green energy. [5] All we need to do is simply observe the relative price of crude oil here and now, plug this price into Figure 2 and draw the resulting value for differential EPS 12 months later. Bottom line: it’s all in the price.
And this reductionist rule, although half-a-century old, continues to work like new. Russia’s 2022 invasion of Ukraine helped double the relative price of oil from its two-decade low, and according to Figure 2, 12 months later this rise helped multiply the differential EPS of the oil companies (and OPEC’s oil exports) many times over from their half-a-century nadir. And if the current Hamas-Israel war continues and even expands, it is not hard to imagine yet another synchronized rise in differential oil prices, exports and EPS.
4. Energy conflicts and differential returns
So far, we have shown that the net profit of the oil companies and the oil exports of OPEC, measured in constant dollars, are tightly correlated (Figure 1), and that changes in differential oil EPS (and presumably also in OPEC’s oil exports relative to global GDP) correlate tightly with changes in relative oil prices (Figure 2). In this section, we connect these two processes to the periodic eruption of energy conflicts.
The vertical bars in Figure 3 show the differential return on equity of the Petro Core relative to that of the Fortune500. We compute this differential first by calculating the ratio of net profit to owners’ equity for both the Petro Core and the Fortune 500, and then by subtracting the latter from the former. If the difference is positive (grey bars), it means that the Petro Core beats the average with a higher return on equity. If it is negative (black bars), it implies that the Petro Core trails the average, with a lower return on equity.
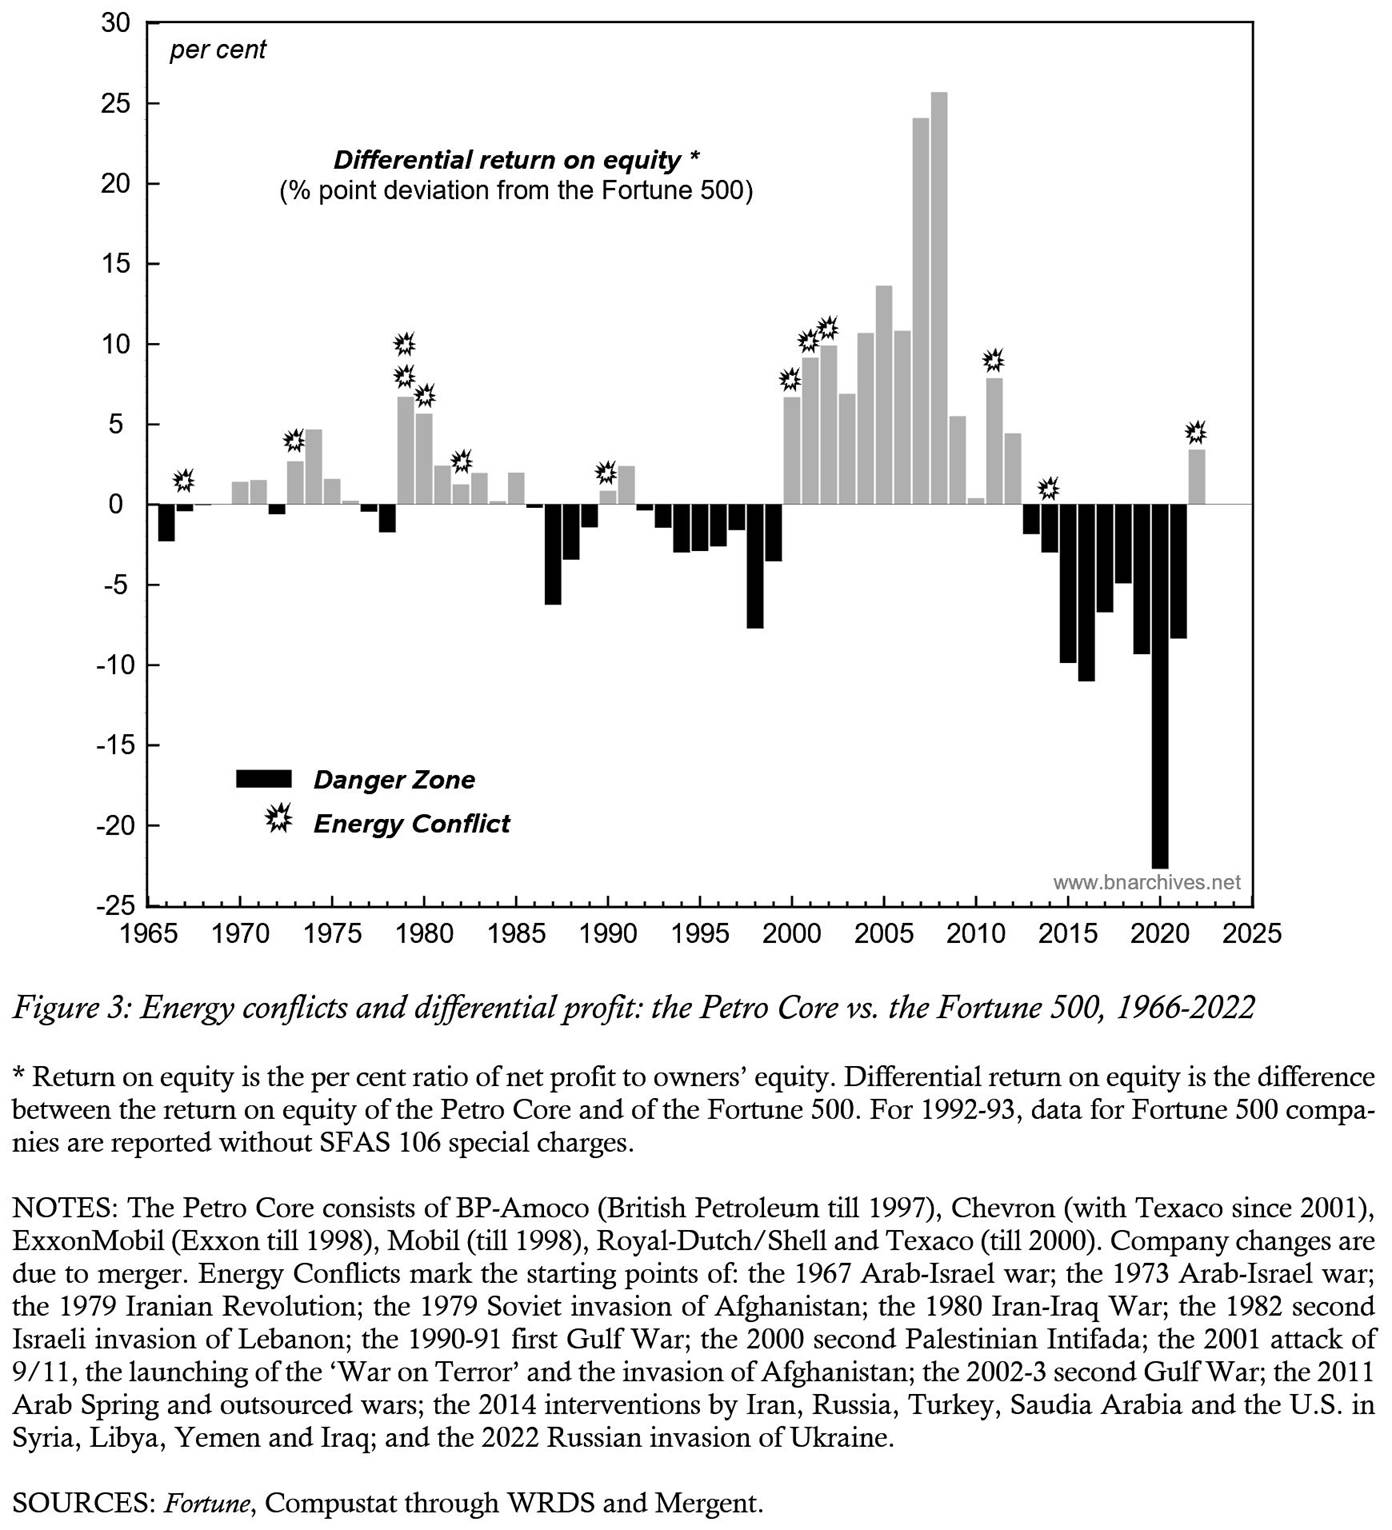
For reasons that will become clear in a moment, we consider a stretch of negative differential returns a danger zone – i.e., a period during which an energy conflict is likely to erupt. The breakout of each energy conflict is marked by an explosion sign and named in the notes underneath the figure.
And here there arise three remarkable regularities.
First, and most importantly, every energy conflict save one was preceded by the Petro Core trailing the average. In other words, for a Middle East energy conflict to erupt, the leading oil companies first must differentially decumulate. [6] The only exception to this rule is the 2011 burst of the Arab Spring and the subsequent blooming of ‘outsourced wars’ (our term for the fighting in Lebanon-Syria-Iraq that was financed and supported by a multitude of governments and NGOs in and outside the region). That specific round erupted without a prior danger zone – although the Petro Core was very close to falling below the average. In 2010, its differential return on equity dropped to a razor-thin 0.4 per cent, down from around 25 per cent in both 2008 and 2009.
Second, every energy conflict save one – the multiple interventions in 2014 – was followed by the oil companies beating the average. In other words, war and conflict in the region – processes that customarily are blamed for rattling, distorting and undermining the aggregate economy – have served the differential interest of the large oil companies (and OPEC) at the expense of leading non-oil firms (and countries). [7] This finding, however striking, should not surprise us. As we have seen, differential oil profit is intimately correlated with the relative price of oil (Figure 2); the relative price of oil in turn is highly responsive to Middle East ‘risk’ perceptions, real or imaginary; these risk perceptions tend to jump in preparation for and during armed conflict; and as risks mount, they raise the relative price of oil and therefore the differential profit of the oil companies.
Third and finally, according to these data, the Petro Core never managed to beat the average without there first being an energy conflict in the region. In other words, the differential performance of the oil companies depends not on production, but on the most extreme form of sabotage: war.
With these regularities in mind, the recent decade has been truly exceptional. We have already seen how the 2010s collapse of OPEC’s ‘real’ oil revenues, expressed in per capita terms, rolled these countries back half a century, and how, during that period, the Petro Core sustained its biggest losses ever. This is the picture in absolute terms.
In relative terms – which is the measure capitalists and state rulers revere the most – the situation was equally bad, if not worse. As Figure 3 shows, beginning in 2013, the Petro Core trailed the average with unprecedented differential losses that even the multiple conflicts of 2014 failed to alleviate. On the face of it, the Petro Core’s inability to pull itself out of the danger zone suggested it was withering away, unable to rejuvenate its profit let alone lead the capitalist pack.
But existential crises often tease unity out of division – in this case, unity between the rulers of the losing countries and companies. And indeed, when all seemed lost, the oil market started smelling war: in 2022 Russia invaded Ukraine, and a year later Hamas burst into Israel. The 2022 differential performance of the Petro Core turned positive, and if the ongoing Hamas-Israel fighting continues – and possibly expands into a border war – these increases, along with OPEC’s relative oil revenues, could be augmented even further.
5. The broader picture
Now, admittedly, our reductionism, although statistically robust, does seem excessive. How can a single variable – in this case, the differential profit of the oil companies – explain more than half a century of Middle East conflicts (and be predicted by these very conflicts to boot)? Can this variable substitute for the region’s local and global complexities? Even if we complemented it with the shenanigans of the superpowers, oil and weapon companies and OPEC executives, the resulting vista would still be too narrow. It would leave out a hugely rich canvas, interwoven by a great many experts from different disciplines, including international relations, economics, culture, orientalism, religion, gender, race, geology, climate and the environment. Is this complex canvas totally irrelevant?
These are valid questions. As noted at the beginning of our paper, the history of Middle East conflicts is affected by numerous interlaced causes: intra-state ethnic tensions, authoritarian regimes exporting their internal conflicts, shifting inter-state alliances and rivalries, superpower confrontations and the rise of contending powers, the disintegration of the old global order, clashes of ideology, nationalism, clericalism and cultural traditions, population growth and water shortages. The list goes on.
But here is the problem. The very specificity of these explanations fractures and disconnects them from each other, and these fractures and disconnections make it difficult if not impossible to capture the general picture we present. Moreover, because these specific explanations are oblivious to the abiding differential logic of the capitalist mode of power, they do not – and cannot – say anything about the overriding regularities of the Weapondollar-Petrodollar Coalition and Middle East energy conflicts.
Put somewhat differently, our theoretical approach does not preclude or contest existing explanations of specific conflicts as such; instead, it offers a general perspective that seems to underpin them all. At times, this general perspective coincides or sits side by side with existing explanations of particular conflicts; at others, it transcends them.
Now, although temporally robust, our approach remains historical. And while it is true that the Weapondollar-Petrodollar Coalition is still crucial for understanding Middle East conflicts, it is by no means eternal.
Over the past half century, the position of this coalition has been adversely affected by two important developments. One is that the United States and Russia, besieged by rising inequalities, soaring debts and impoverished populations, have seen their world supremacy challenged by China, India and other big ‘emerging markets’ and their leverage in the Middle East contested by regional powers like Iran and Turkey. The other is that the old-economy emphasis on energy and weapons has been increasingly undermined by a new economy that relies on high technology, communications, pharmaceuticals and biotech.
One result of these developments, crucial to our story, is highlighted in Figure 4. The solid series shows the power of the Weapondollar-Petrodollar Coalition, proxied by the global net profit share of listed aerospace companies and integrated oil & gas firms. [8] The series demonstrates that, during the 1970s and 1980s, the Weapondollar-Petrodollar Coalition reigned supreme, muscling roughly 1/5th of all net profit earned by the world’s listed companies. But it also shows that from then on, the Coalition’s power trended southward. Despite repeated energy conflicts with large-scale military hostilities, millions of casualties, horrific civilian massacres, mass incarceration, deportation and the wholesale destruction of societal infrastructures that together brought oil-market panics, systemic instability and the disintegration of states, the global net profit share of the armament and oil firms has continued to shrink.
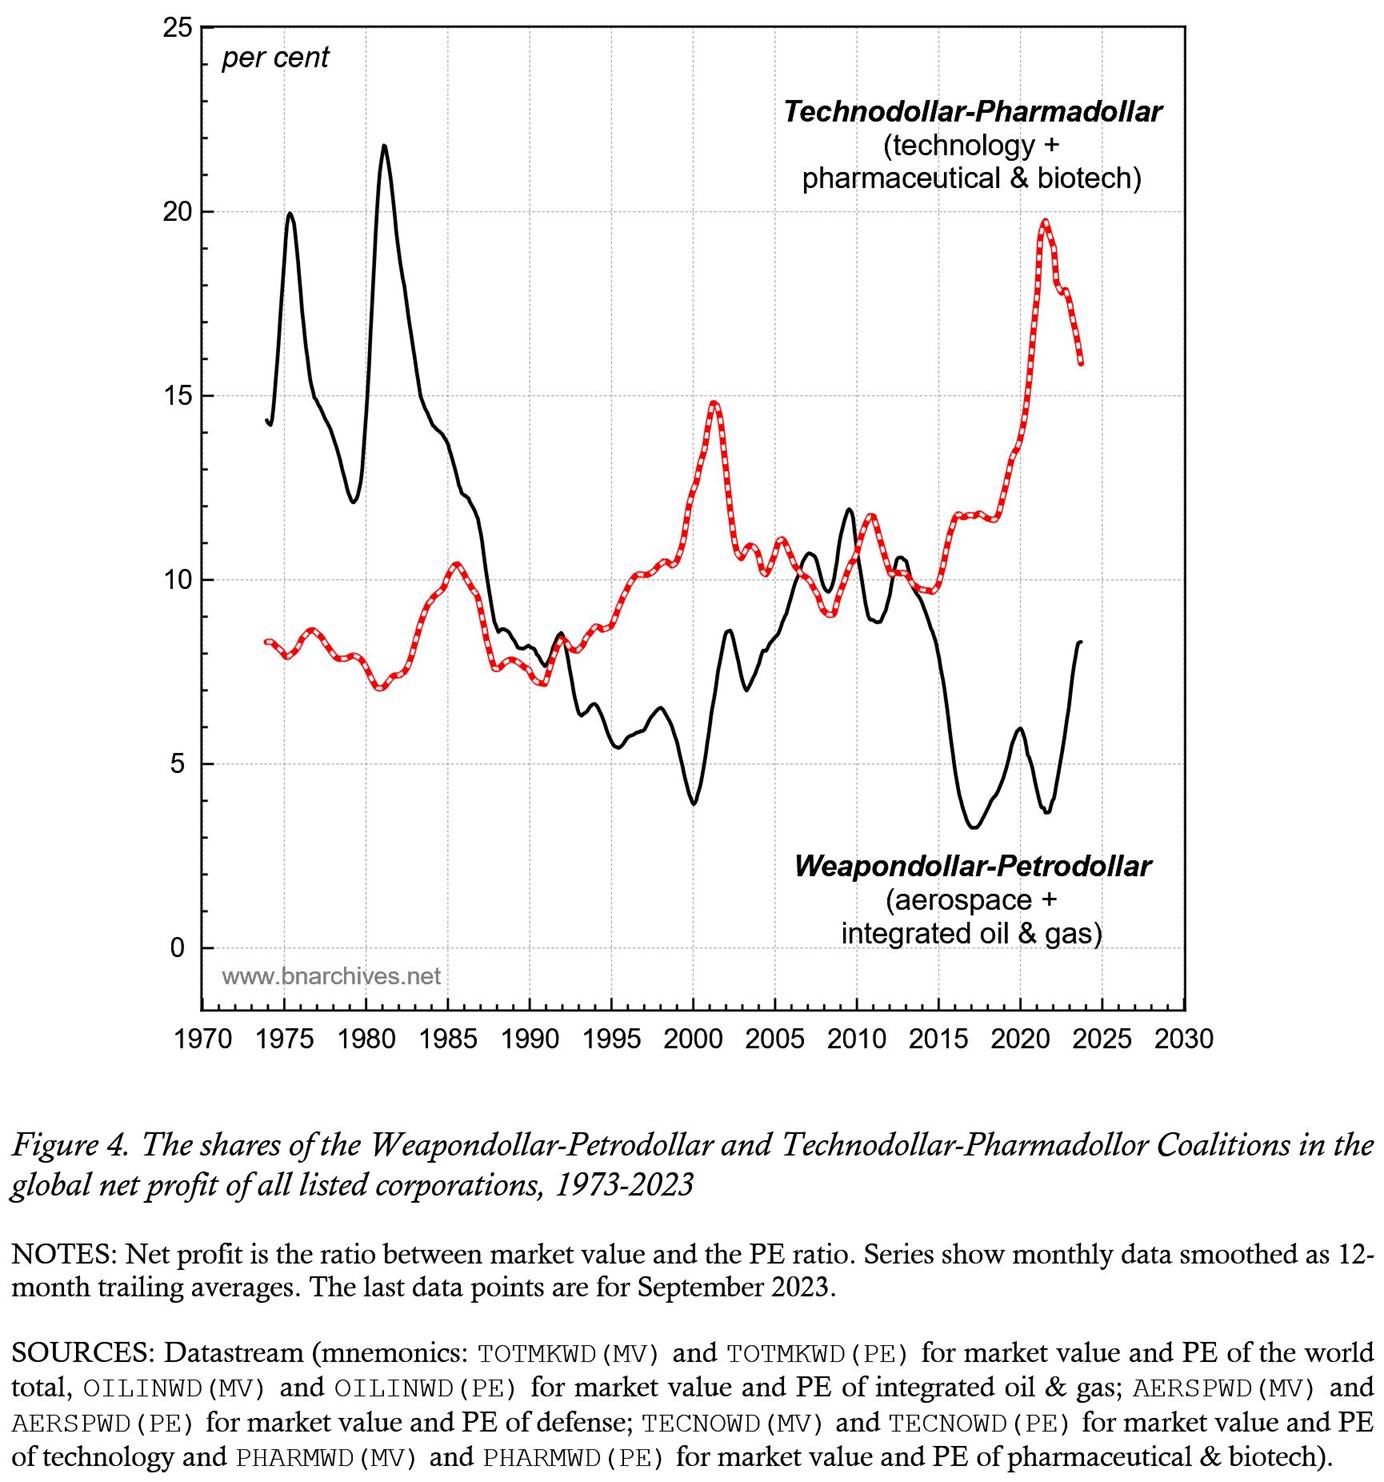
By 2000, this share was down to a mere 4 per cent – 80 per cent below its all-time peak in the early 1980s. The bellicose aftermath of September 11, 2001, gave the Weapondollar-Petrodollar Coalition a facelift, pushing its global net profit share to 12 per cent by the end of the decade. But the recovery was short lived. In the 2010s, the Coalition’s net profit share drifted further down, and in 2017 it hit a 3 per cent nadir. The 2022 Russia-Ukraine and 2023 Hamas-Israel wars seem to have once again revived the Coalition’s dwindling prospects, but whether this revival marks the onset of a long-term uptrend or a temporary blip in its continued decline is anyone’s guess.
This long-term descent is mirrored by the uptrend of the ‘Technodollar-Pharmadollar Coalition’, made up of listed technology, pharmaceutical and biotech firms. The differential power of this new alliance, measured by its global net profit share, is shown by the dashed red series, which, in the early 2020s reached 20 per cent – almost as high as the Weapondollar-Petrodollar Coalition’s peak of the early 1980s. Significantly, the chart also shows that the two coalitions move countercyclically over shorter periods.
This inverse performance is not difficult to explain. The Weapondollar-Petrodollar Coalition is ‘brick and mortar’. It sells tangible stuff and profits differentially from the relative inflation induced by international instability and chaos. By contrast, the Technodollar-Pharmadollar Coalition relies primarily on ‘intangible’ commodities. Its differential profit comes from privatizing collective societal knowledge as intellectual property, appropriating the rights to this property, and upping the relative markup on those rights.
And here is the key point: the general conditions necessary for the spread, imposition and inflationary appreciation of intellectual property rights are opposite to those conducive to the inflation of weapon and oil prices. They require not instability, naked force and open violence, but the appearance of stability, both domestic and international, and the seeming prevalence of ‘law and order’.
In other words, the overall settings that boost one coalition tend to undermine the other – and vice versa. And since both coalitions have considerable leverage in domestic policy and international relations, it makes the conflict between them crucial for the fate of the Middle East and beyond.
And this is not a new phenomenon. The potential significance of intraclass conflicts was illustrated during the 1960s by Michael Kalecki. In his essays ‘The Fascism of Our Times’ (1964) and ‘Vietnam and U.S. Big Business’ (1967), he predicted that continued U.S. involvement in Vietnam would increase the dichotomy between the ‘old’, largely civilian business groups located mainly on the U.S. East Coast, and the ‘new’ militarized business groups, primarily the arms contractors, of the West Coast. The rise in military budgets, he anticipated, would force a redistribution of income from the old to the new groups. The ‘angry elements’ within the U.S. ruling class would then be significantly strengthened, pushing for a more aggressive foreign policy and a war economy: ‘It is a sad world indeed where the fate of all mankind depends upon the fight between two competing groups within American big business. This, however, is not quite new: many far-reaching upheavals in human history started from a cleavage at the top of the ruling class’ (Kalecki 1967: 114).
Endnotes
[1] The article’s title pays homage to Lev Nussimbaum’s riveting historical novel, Blood and Oil in the Orient (Bey 1932; This is the second time we borrow his title. The first was in Bichler and Nitzan 2017a). Shimshon Bichler and Jonathan Nitzan teach political economy at colleges and universities in Israel and Canada, respectively. All their publications are available for free on The Bichler & Nitzan Archives (https://bnarchives.net). Work on this paper was partly supported by SSHRC.
[2] Note that militias are also growing in number and importance elsewhere in the world. In our view, this worldwide phenomenon reflects, at least in part, the widening mismatches and contradictions between the nation state and global accumulation.
[3 On the connection between energy conflicts and differential accumulation, see Bichler and Nitzan (1996, 2004, 2015, 2017a, 2017b, 2018, 2020), Bichler, Nitzan and Rowley (1989), Bichler, Rowley and Nitzan (1989), Nitzan and Bichler (1995; 2002: Ch. 5; 2006), Nitzan, Rowley and Bichler (1989) and Rowley, Bichler and Nitzan (1989).
[4] Since the CPI covers only consumer goods and services, it might seem better to use the comprehensive GDP deflator. The drawback is that, unlike the CPI, which is a monthly fixed-basket index, the basket of the GDP deflator changes continuously, and the index itself is estimated only quarterly. Fortunately, the two measures tend to move in tandem, so we use the more familiar CPI.
[5] Surprising as it may sound, mainstream economists cannot explain actual profits and prices, and for the simplest of reasons: their key explanatory categories of supply, demand and equilibrium – and therefore of scarcity – can be neither observed nor measured. They are purely imaginary (Bichler and Nitzan 2021; Nitzan and Bichler 2009: Chs. 5 and 8). The practical implications of this theoretical vacuum for the oil business are examined in Nitzan and Bichler (1995: 487-492) and Bichler and Nitzan (2015: 50-54; 75-76).
[6] In the late 1970s and early 1980s, and again during the 2000s, differential decumulation was sometimes followed by a string of conflicts stretching over several years. In these instances, the result was a longer time lag between the initial spell of differential decumulation and some of the subsequent conflicts.
[7] A key point to note here is the effect of energy conflicts not on absolute but differential oil returns. For example, in 1969-1970, 1975, 1980-1982, 1985, 1991, 2001-2002, 2006-2007, 2009 and 2012, the rate of return on equity of the Petro Core fell; but in all cases the fall was either slower than that of the Fortune 500 or too small to close the positive gap between them, so despite the absolute decline, the Petro Core continued to beat the average.
[8] Note that this measure focuses on overall net profit, which is different from the one based on EPS in Figure 2.
References
Barnet, Richard J. 1980. The Lean Years. Politics in the Age of Scarcity. New York: Simon and Schuster.
Bey, Essad. 1932. Blood and Oil in the Orient. Translated from the German by Elsa Talmey. New York: Simon and Schuster.
Bichler, Shimshon, and Jonathan Nitzan. 1996. Putting the State In Its Place: US Foreign Policy and Differential Accumulation in Middle-East “Energy Conflicts”. Review of International Political Economy 3 (4): 608-661.
Bichler, Shimshon, and Jonathan Nitzan. 2004. Dominant Capital and the New Wars. Journal of World-Systems Research 10 (2, August): 255-327.
Bichler, Shimshon, and Jonathan Nitzan. 2015. Still About Oil? Real-World Economics Review (70, February): 49-79.
Bichler, Shimshon, and Jonathan Nitzan. 2017a. Blood and Oil in the Orient, Redux. Research Note (December): 1-11.
Bichler, Shimshon, and Jonathan Nitzan. 2017b. Profit Warning: There Will Be Blood. Real-World Economics Review Blog, December 10.
Bichler, Shimshon, and Jonathan Nitzan. 2018. Arms and Oil in the Middle East: A Biography of Research. Rethinking Marxism 30 (3): 418-440.
Bichler, Shimshon, and Jonathan Nitzan. 2020. Still in the Danger Zone. Real-World Economics Review Blog, January 17.
Bichler, Shimshon, and Jonathan Nitzan. 2021. The 1-2-3 Toolbox of Mainstream Economics: Promising Everything, Delivering Nothing. Real-World Economics Review (98, December): 23-48.
Bichler, Shimshon, Jonathan Nitzan, and Robin Rowley. 1989. The Political Economy of Armaments. Working Paper 7/89, Department of Economics, McGill University, Montreal, pp. 1-34.
Bichler, Shimshon, Robin Rowley, and Jonathan Nitzan. 1989. The Armadollar-Petrodollar Coalition: Demise or New Order? Working Paper 11/89, Department of Economics, McGill University, Montreal, pp. 1-63.
Kalecki, Michal. 1964. [1972]. The Fascism of Our Times. In The Last Phase in the Transformation of Capitalism, edited by M. Kalecki. New York and London: Monthly Review Press, pp. 99-105.
Kalecki, Michal. 1967. [1972]. Vietnam and U.S. Big Business. In The Last Phase in the Transformation of Capitalism, edited by M. Kalecki. New York and London: Monthly Review Press, pp. 107-114.
Nitzan, Jonathan, and Shimshon Bichler. 1995. Bringing Capital Accumulation Back In: The Weapondollar-Petrodollar Coalition — Military Contractors, Oil Companies and Middle-East “Energy Conflicts”. Review of International Political Economy 2 (3): 446-515.
Nitzan, Jonathan, and Shimshon Bichler. 2002. The Global Political Economy of Israel. London: Pluto Press.
Nitzan, Jonathan, and Shimshon Bichler. 2006. New Imperialism or New Capitalism? Review XXIX (1, April): 1-86.
Nitzan, Jonathan, and Shimshon Bichler. 2009. Capital as Power. A Study of Order and Creorder. RIPE Series in Global Political Economy. New York and London: Routledge.
Nitzan, Jonathan, Robin Rowley, and Shimshon Bichler. 1989. Changing Fortunes: Armaments and the U.S. Economy. Working Paper 8/89, Department of Economics, McGill University, Montreal, pp. 1-27.
Rowley, Robin, Shimshon Bichler, and Jonathan Nitzan. 1989. The Armadollar-Petrodollar Coalition and the Middle East. Working Paper 10/89, Department of Economics, McGill University, Montreal, pp. 1-54.
Turner, Louis. 1983. Oil Companies in the International System. 3rd ed. London and Winchester, Mass., USA: Royal Institute of International Affairs and Allen & Unwin.
Yergin, Daniel. 1991. The Prize. The Epic Quest for Oil, Money, and Power. New York: Simon and Schuster.
taken from here