

1. Introduction
In 2012, we published a paper in the Journal of Critical Globalization Studies titled ‘Imperialism and Financialism: The Story of a Nexus’. Our topic was the chameleon-like Marxist notion of imperialism and how its different theories related to finance. Here is the article’s summary:
Over the past century, the nexus of imperialism and financialism has become a major axis of Marxist theory and praxis. Many Marxists consider this nexus to be a prime cause of our worldly ills, but the historical role they ascribe to it has changed dramatically over time. The key change concerns the nature and direction of surplus and liquidity flows. The first incarnation of the nexus, articulated at the turn of the twentieth century, explained the imperialist scramble for colonies to which finance capital could export its excessive surplus. The next version posited a neo-imperial world of monopoly capitalism where the core’s surplus is absorbed domestically, sucked into a black hole of military spending and financial intermediation. The third script postulated a World System where surplus is imported from the dependent periphery into the financial core. And the most recent edition explains the hollowing out of the U.S. core, a red giant that has already burned much of its own productive fuel and is now trying to financialize the rest of the world in order to use the system’s external liquidity. The paper outlines this chameleon-like transformation, assesses what is left of the nexus and asks whether it is worth keeping. (p. 42)
In the second part of the paper, we looked a little closer at the red-giant argument. Specifically, we wanted to gauge the degree to which U.S. capital had declined and examine whether this decline indeed forced the rest of the world to financialize. And what we found surprised us: the ‘financial sector’ did seem to become more important everywhere, but its rise was led not by the United States, but by the rest of the world!
Our article was published almost a decade ago, so we though it would be interesting to update our figures and see what has changed, if anything.
2. Globalization
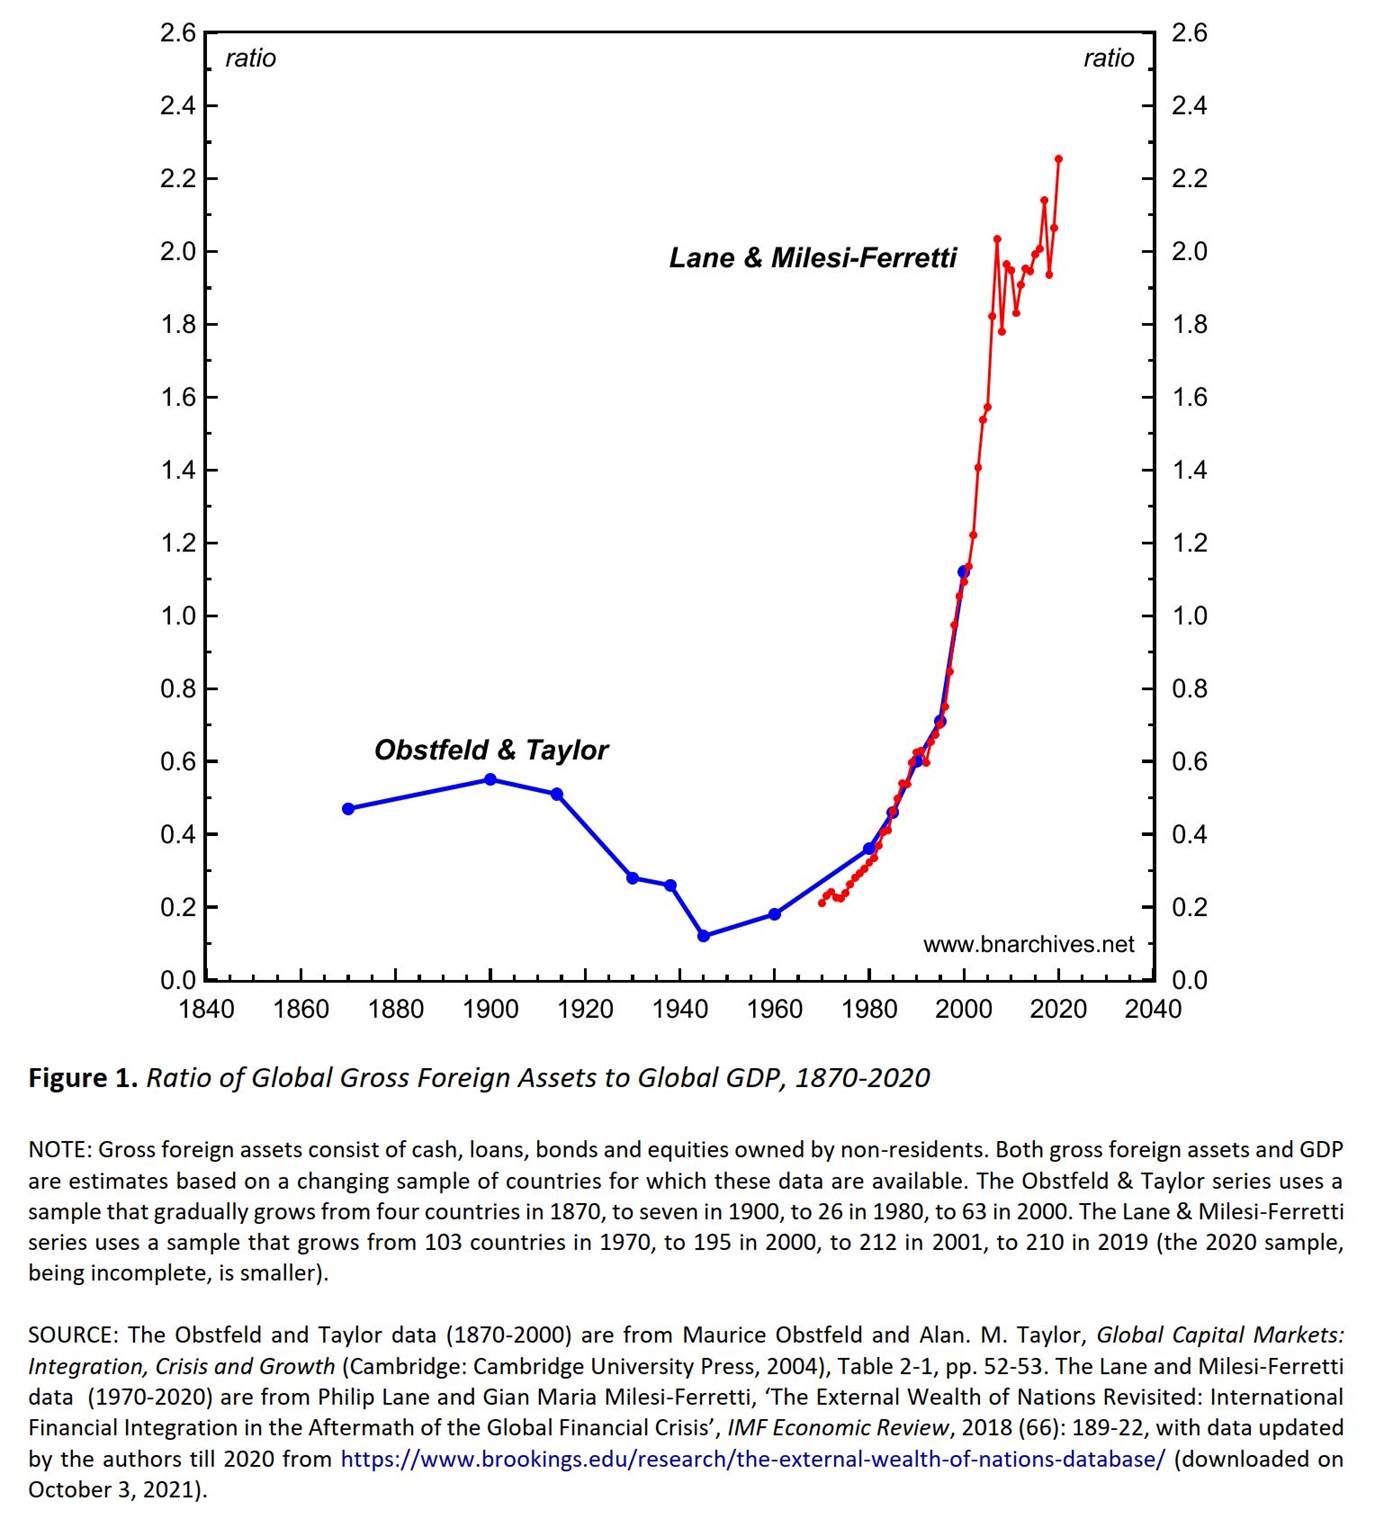
Figure 1 plots the ratio between the world’s gross foreign-owned assets and its GDP (for every observation, the two magnitudes of this ratio reflect only those countries for which both foreign ownership and GDP data are available). This ratio shows how the globalization of capital (1) declined in the interwar period; (2) resurged in the postwar era; and (3) decelerated recently.
3. Rise and Decline
Figure 2 disaggregates the overall picture by looking at the rise and decline of the two most imperial-read-largest-foreign-owning countries: Britain and the United States.
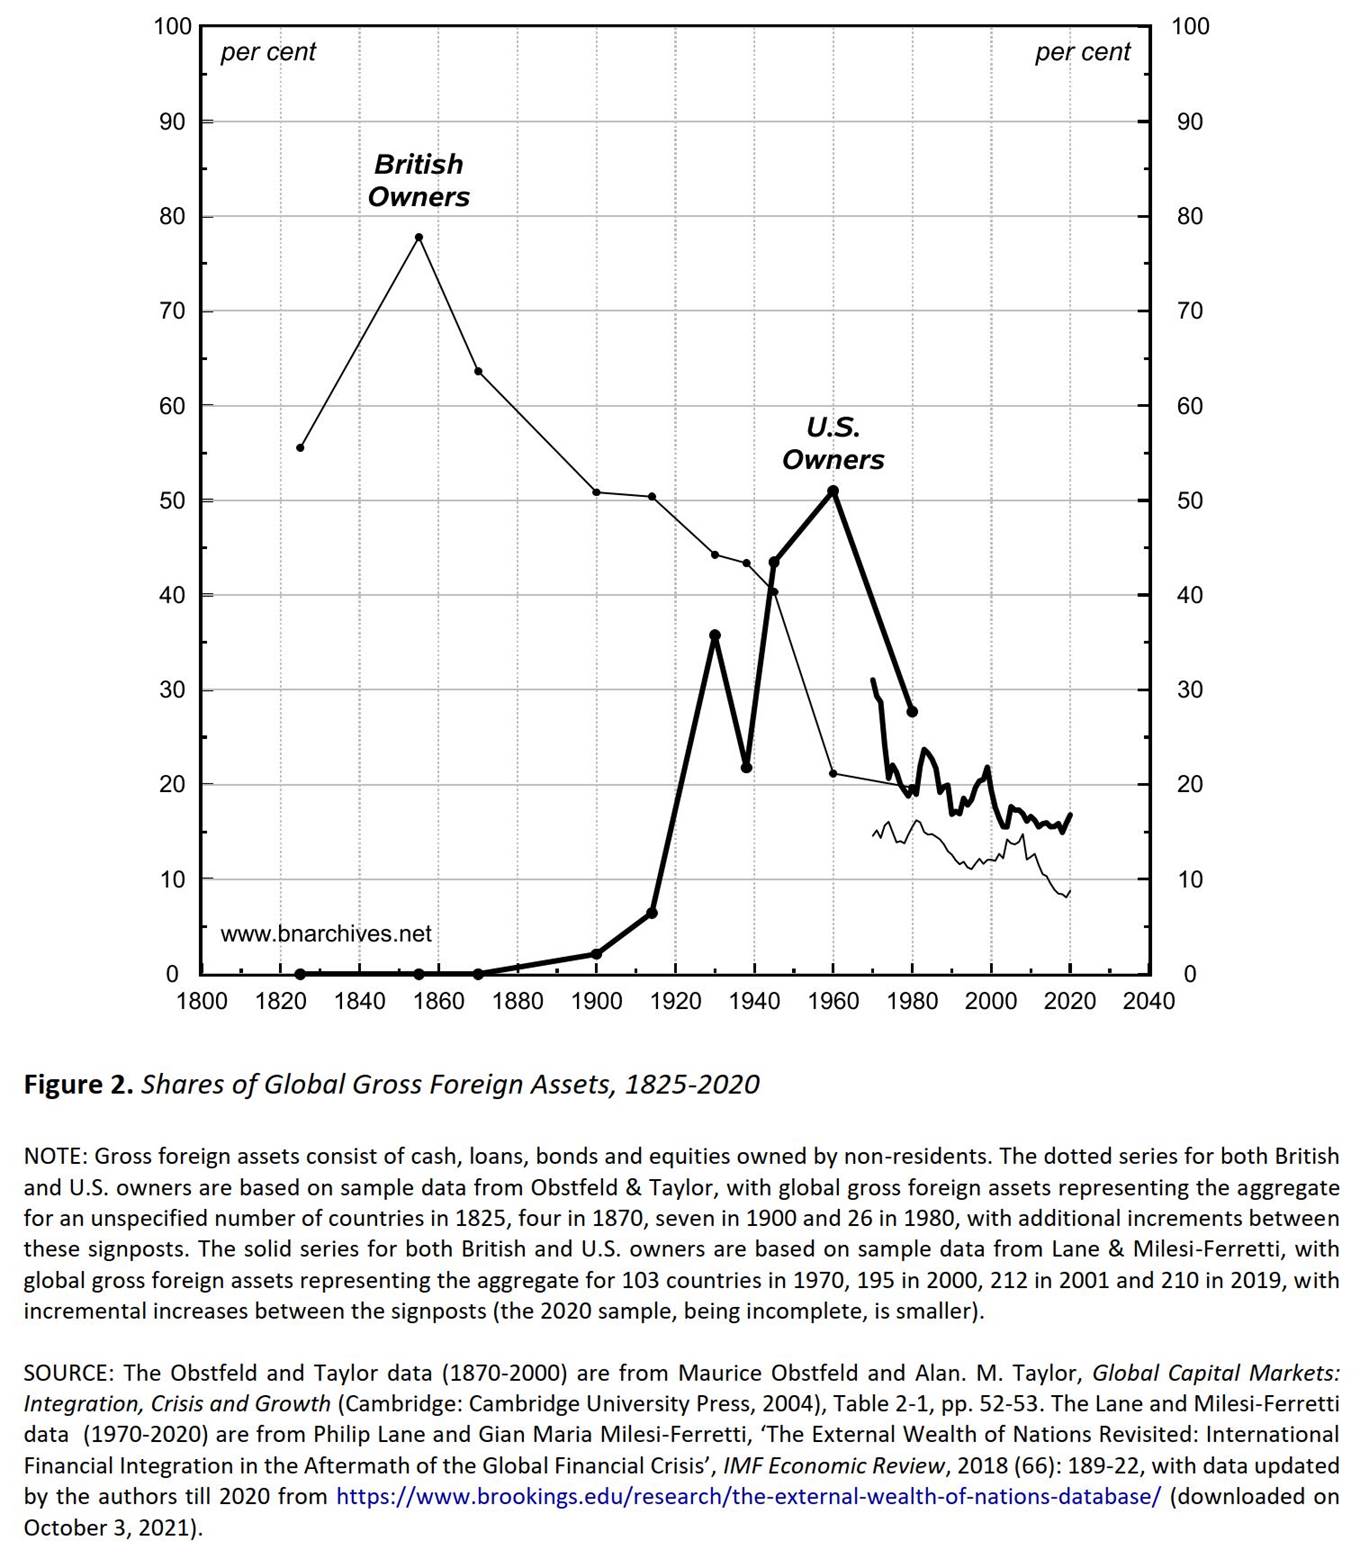
The data are from two different sources, and, understandably, the one pertaining to the earlier period is not very accurate. But the overall picture is clear enough. (1) U.K.’s global dominance peaked around the middle of the nineteenth century, when its owners controlled nearly 80 per cent of all foreign assets. From then on, the share of British owners trended downward, reaching less than 10 per cent in 2020. (2) As Britain’s role receded, the United States rose to prominence, and, by 1960, its owners controlled one half of the world’s foreign assets. At the time, this share – although smaller than Britain’s at its peak – was larger than that of any other county. But that peak, too, came and went, and the leading position of the United States, just like Britain’s before it, waned. Nowadays, U.S.-based owners account for roughly 15 of the world’s total foreign assets.
4. The Distribution of Profit
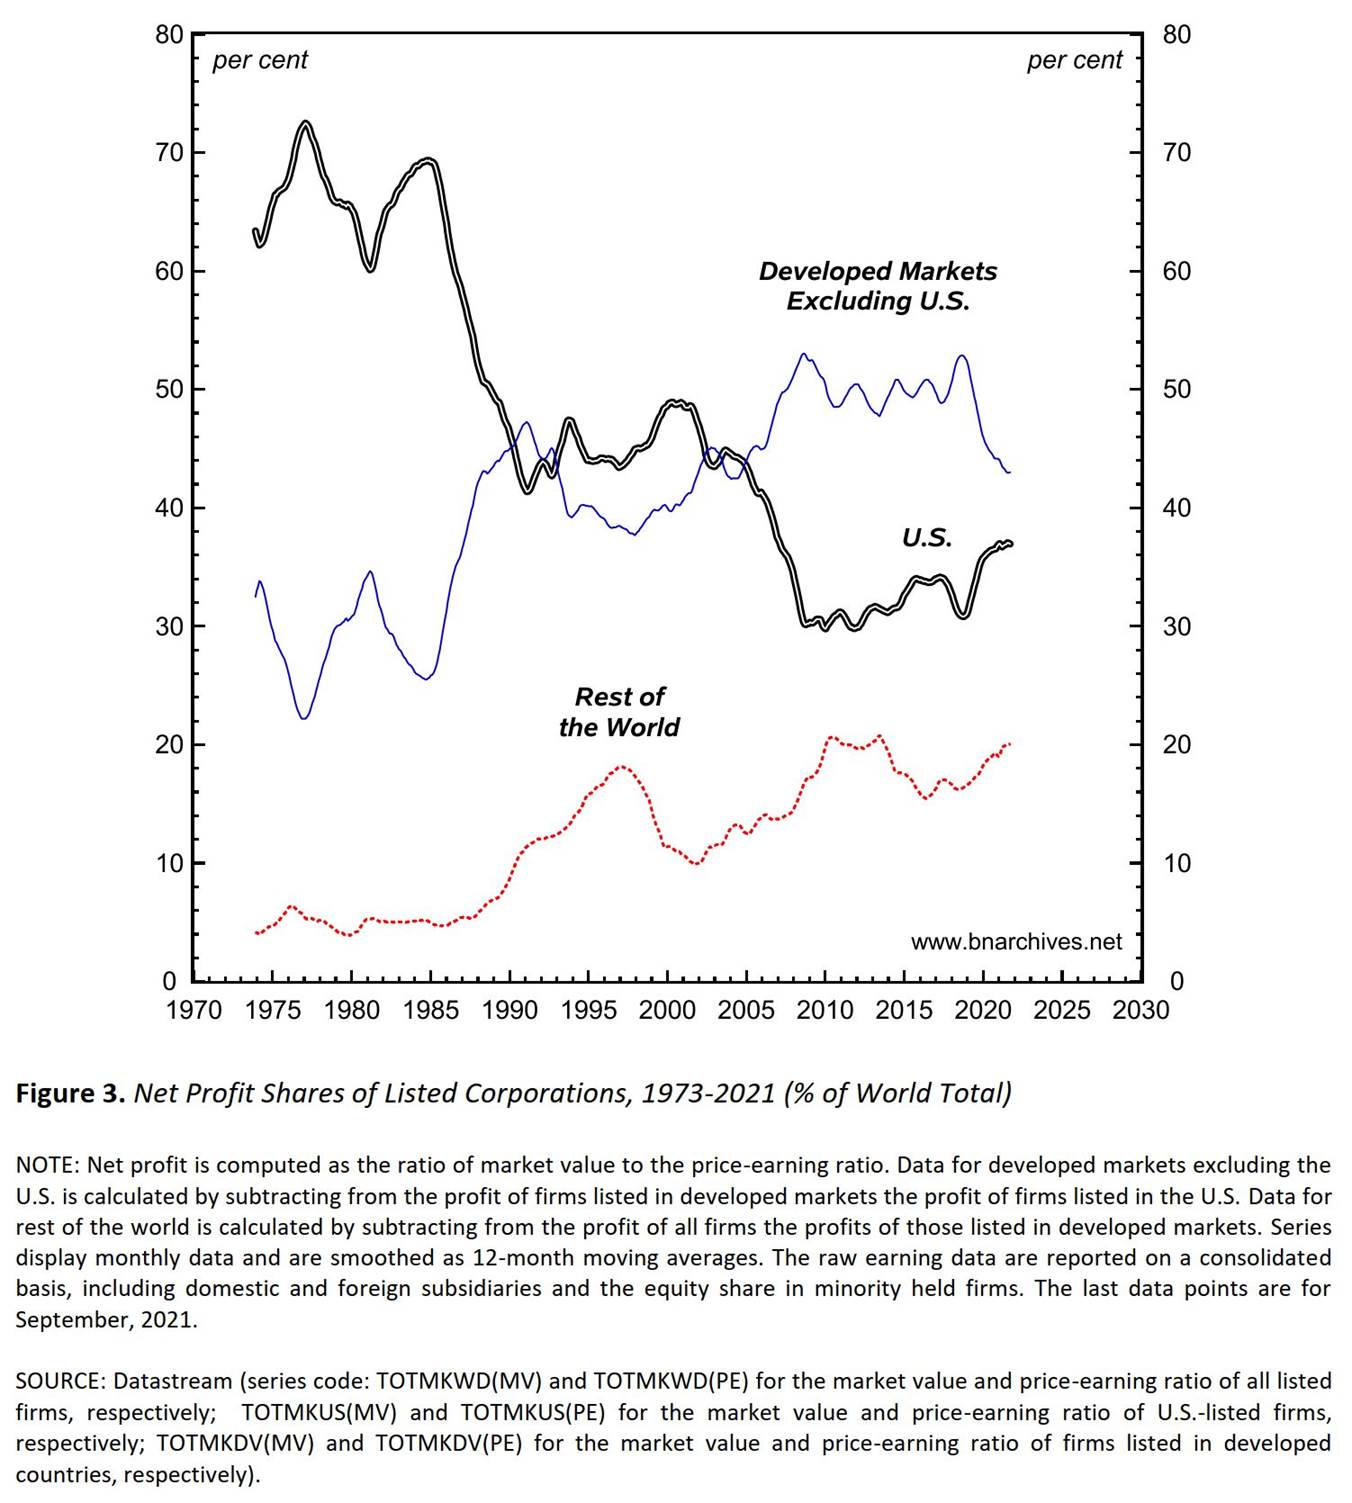
Figure 3examines the more recent decline of U.S. owners from the viewpoint of net profit. The chart shows that, during the late 1970s and early 1980s, U.S.-listed firms accounted for roughly 65 per cent of all listed-corporate profit in the world; that this ratio trended down; and that, nowadays, U.S.-listed firms control only half that much. Mirroring this decline is the rise of the rest of the world – both developed and so-called emerging markets. The short-term fluctuations of these shares are affected by changes in the ‘real-effective exchange rates’ of each region. But their long–term trends denote changes in the relative power of their respective firms.
5. FIRE
According to many, the decline of the United States promoted its corporations and government to financialize their economy and impose this financialization on the rest of the world – presumably in order to suck in some of the world’s surplus.
Unfortunately, this last claim is not easy to assess. The concept of financialization is not only vague and difficult to operationalize; it’s also potentially misleading. Our own view is that all capital – regardless of its ‘sector’ (be it automotive, copper, software, banking, cocaine smuggling, or anything else) and ‘instrument’ (fixed income or equity) – is already finance and nothing but finance.
But, for argument’s sake, let’s leave aside these eccentricities and stick to the conventional creed. One common view is that finance is equivalent to FIRE – an acronym denoting the firms that make up the formal sectors of ‘Finance’, ‘Insurance’ and ‘Real Estate’. Using this common definition, we can measure FIRE’s share in total net corporate profit, and then use the trajectory of this share to assess the extent to which accumulation is being financialized: the greater the ratio, the larger the financialization – and vice versa.
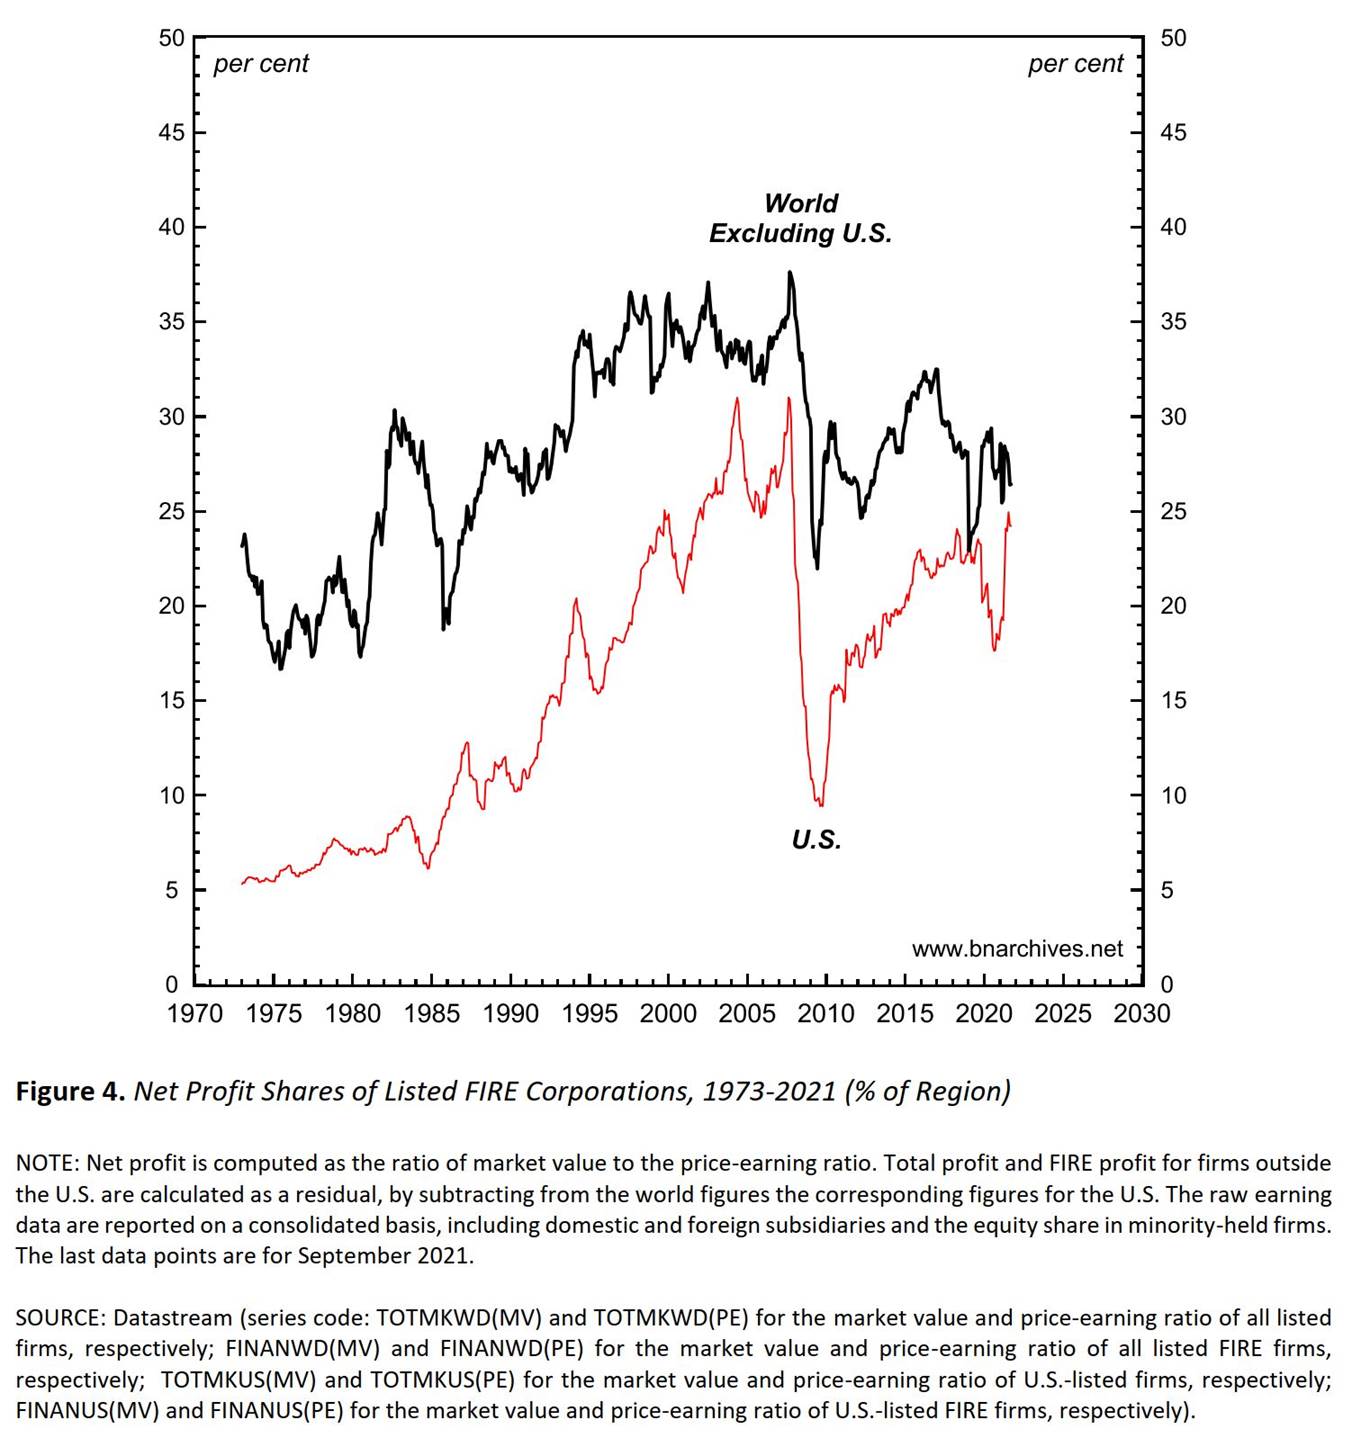
And that is what we do in Figure 4. The two series in the chart show the respective shares of total net profit going to FIRE in the United States and in the rest of the world (listed firms only). As we can see, both shares increased till the late 2000s and have moved down or sideways since then. By this measure, financialization, in the United States and elsewhere, rose until recently and then stabilized. But the chart also makes clear that during this entire process, the share of FIRE in total profit was smaller in the United States than in the rest of the world. In other words, financialization – assuming we accept the very concept and its operational definition here – was led not by the United States, but by other countries!
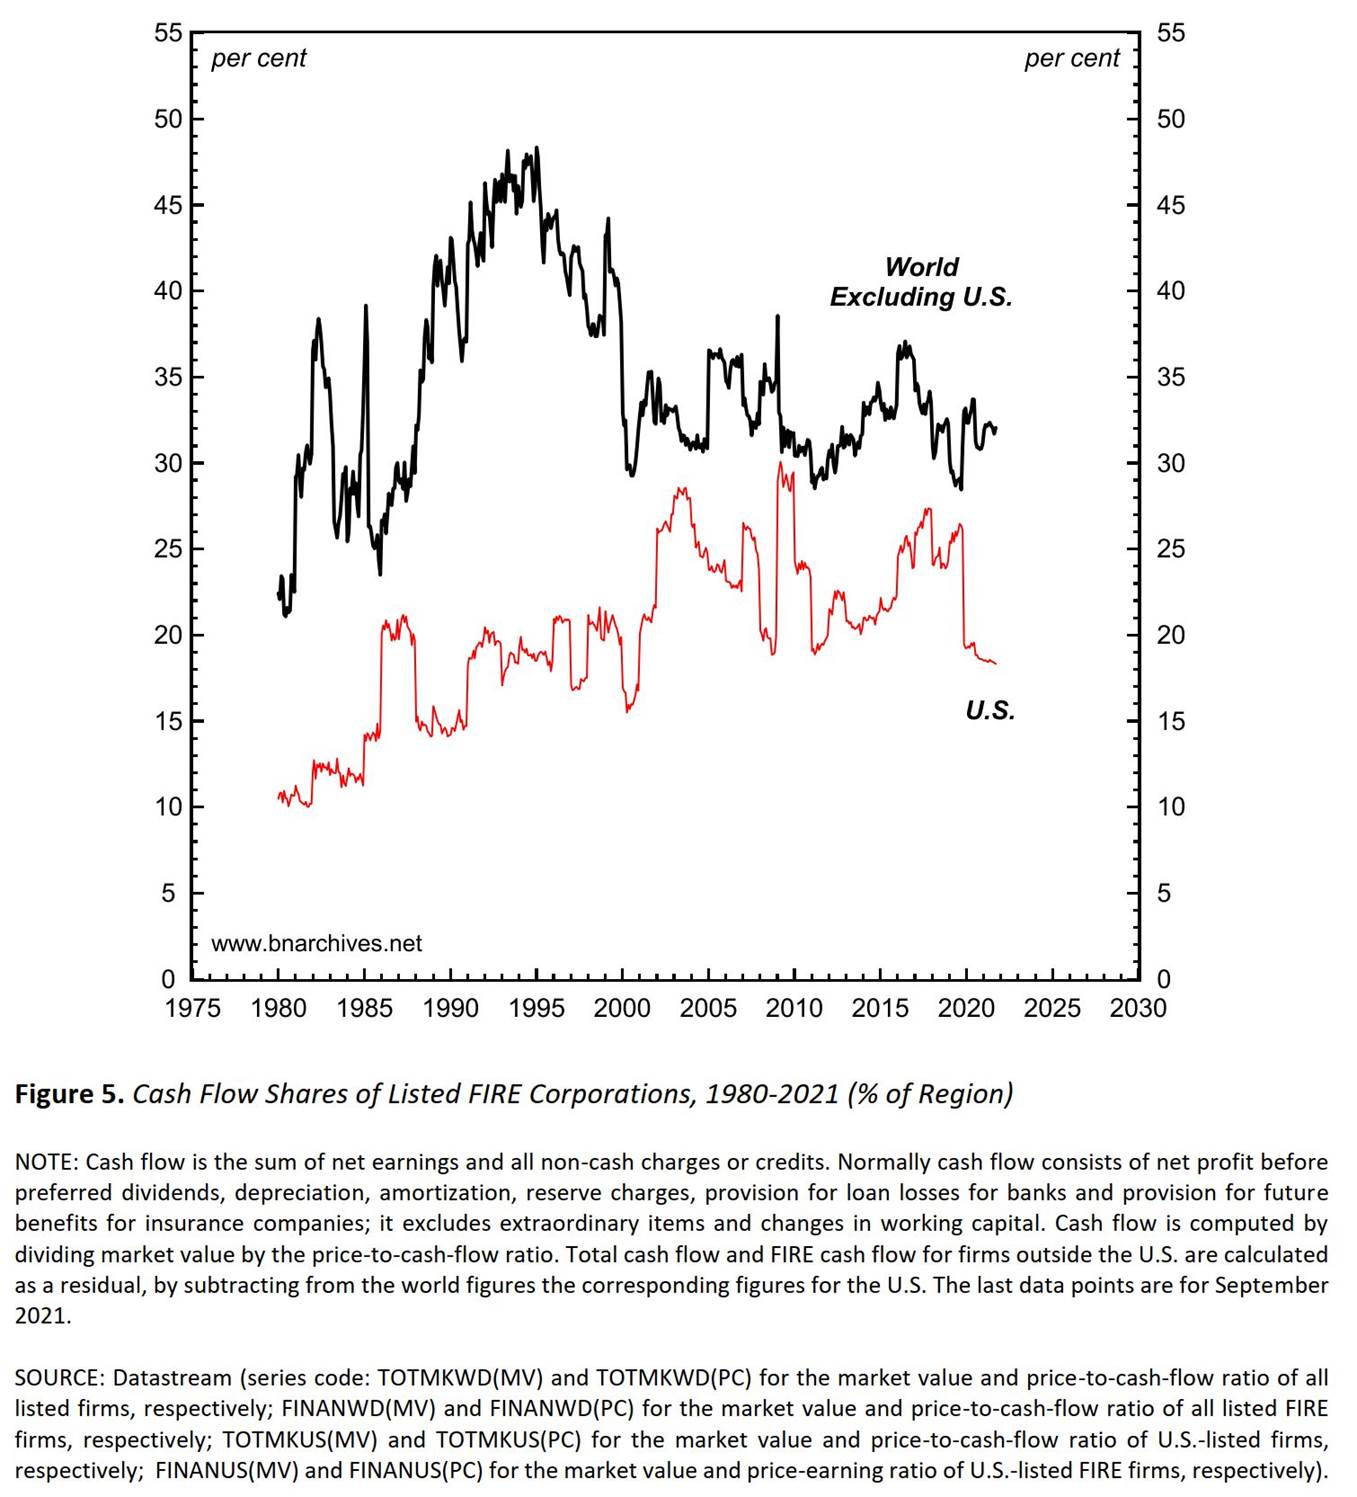
This type of evidence is often rejected by finance experts as misinformed. They argue, first, that large firms and their owners are interested not in net profits but in so-called cash flow; second, that legal and accounting differences across countries affect the movement of these two measures differently and often oppositely; and, third, that as consequence of these differences, a cash-flow analysis might yield radically different conclusions.
So, we checked this angle too. Figure 5 compares the share of total cash flow of the FIRE sector in both the United States and the rest of the world. And what we find, just like with net profit in Figure 4, is that the cash-flow shares of FIRE trend up or sideways in both the United States and elsewhere, but that the United States hasn’t led the rest of the world but lagged it.
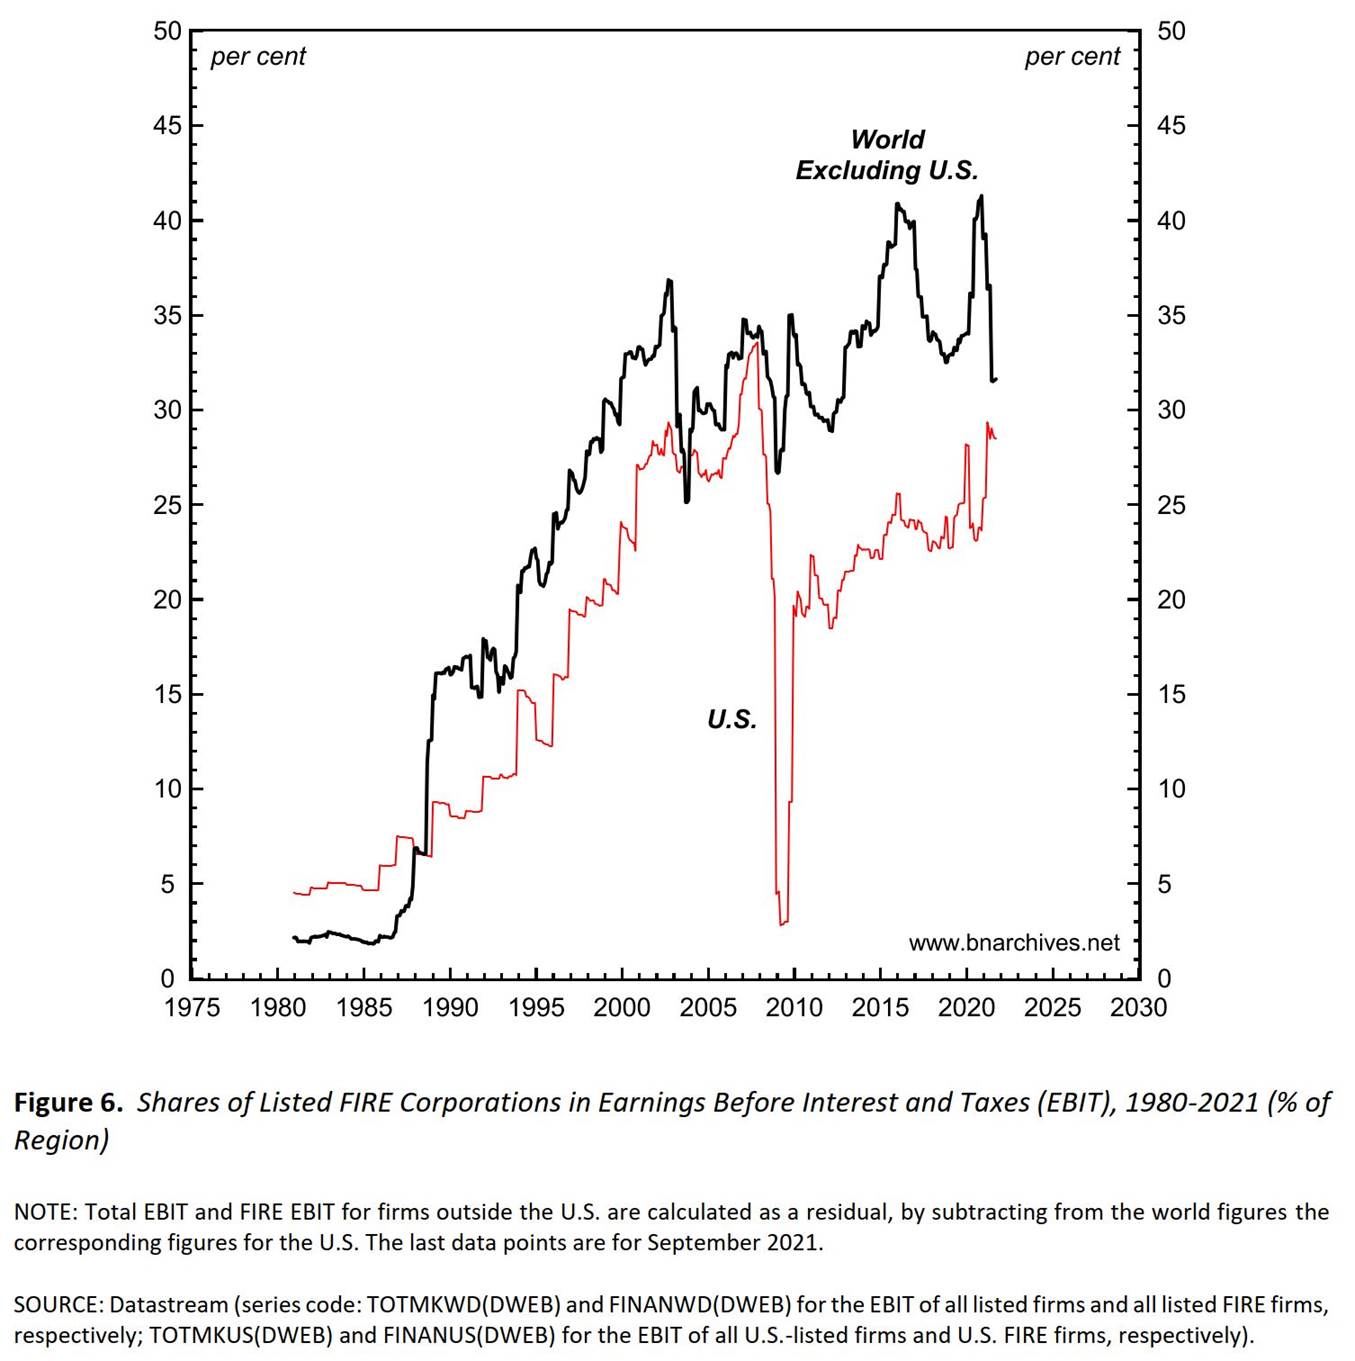
Finally, we also looked at a broad measure of capitalist income – namely, earnings before interest and taxes, or EBIT. This comparison is shown in Figure 6. And here too, the United States is not the leader, but the lagger.
6. Conclusion
The new data remain consistent with our 2012 conclusions: (1) the ownership of capital continues to globalize; (2) the relative power of U.S. capital continues to wane; and (3) there is little evidence that the ‘financialization’ of capital – provided we accept this concept in the first place – has been driven by the United States. If anything, U.S. capital has ‘financialized’ to a lesser extent that capital in the rest of the world.
Endnotes
[1] Shimshon Bichler and Jonathan Nitzan teach political economy at colleges and universities in Israel and Canada, respectively. All their publications are available for free on The Bichler & Nitzan Archives (http://bnarchives.net). Work on this note was partly supported by SSHRC.
taken from here
Foto: Sylvia John